About iCAP
iCAP - immunoClust Automated Pipeline
AI-Tool for automated Clustering, Identification and Quantification of Flow Cytometry Data
Problem & Solution
Problem
- Classic flow cytometry analysis using manual gating requires many user-specific decisions: it is time-consuming and not easily reproducible.
- With increasing markers per test, the complexity of measurement and analysis increases significantly.

Our Solution
- Modern adapted cluster algorithms enable reliable and reproducible population detection for flow cytometry data.
- A co-clustering algorithm with integrated normalization method leads to the detection of stable populations that are comparable across samples.
- Co-clustering with an analysis model enables the sequential analysis of additional samples for diagnostics.
- Cloud computing allows for high throughput of many samples.
iCAP
Clustering, Population Identification and Quantification
CELL-EVENT clustering
Detection of groups of cells with similar staining characteristics in an individual sample
META-CLUSTER-Annotation
Staining dependent hierarchical sorting and characterization of cell (sub-) populations
META clustering
Matching of cell populations (clusters) with similar staining characteristics between multiple samples
CELL-TYPE Quantification
Absolute and relative quantification of populations by numbers of cells per cluster, variability of markers per cluster and comparison with healthy reference
iCAP
Clustering, Population Identification and Quantification
CELL-EVENT clustering
Detection of groups of cells with similar staining characteristics in an individual sample
META clustering
Matching of cell populations (clusters) with similar staining characteristics between multiple samples
META-CLUSTER-Annotation
Staining dependent hierarchical sorting and characterization of cell (sub-) populations
CELL-TYPE Quantification
Absolute and relative quantification of populations by numbers of cells per cluster, variability of markers per cluster and comparison with healthy reference
Fully automatic output of results using AI No group comparisons
Set up and automated Analysis
Initial Set up for a defined staining protocol
Staining and flow cytometry of blood cells from multiple samples of reference group (n=20 to 30)
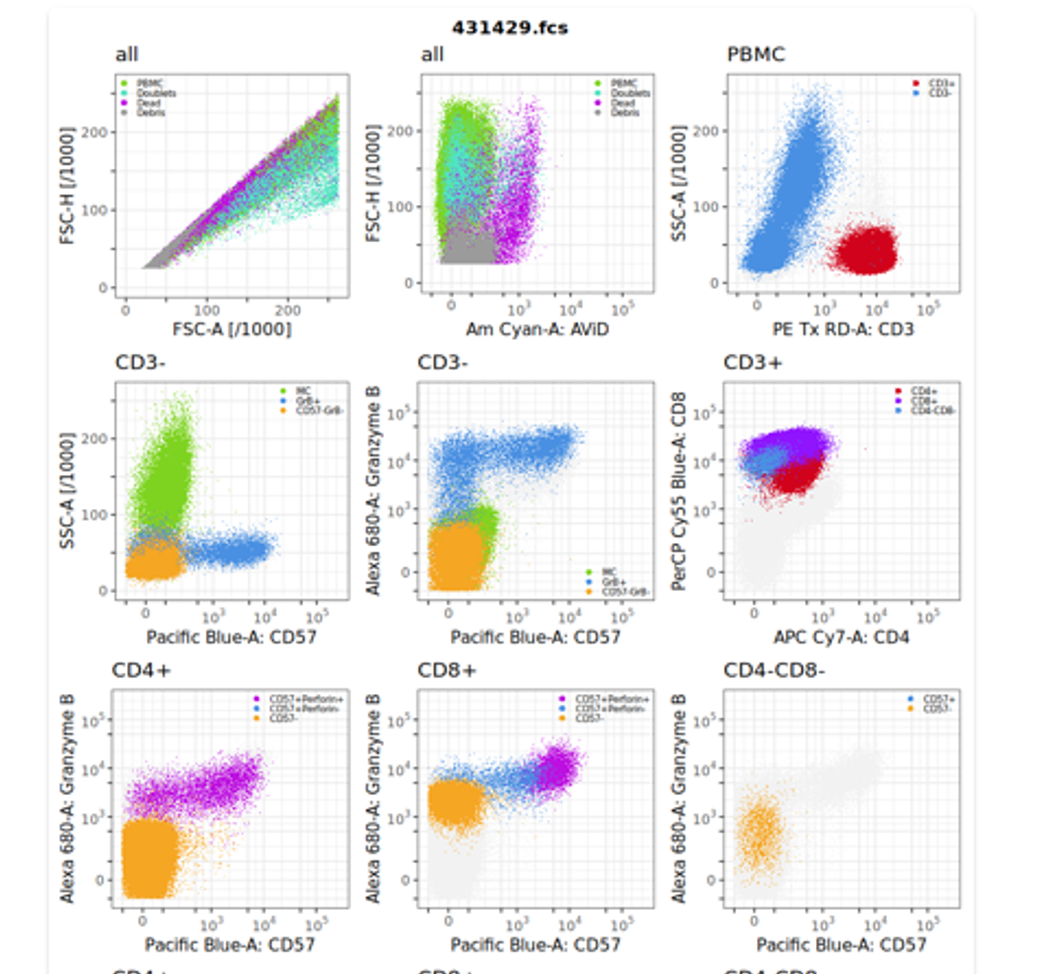
AI-based automated multidimensional clustering of cells of each sample with immunoClust
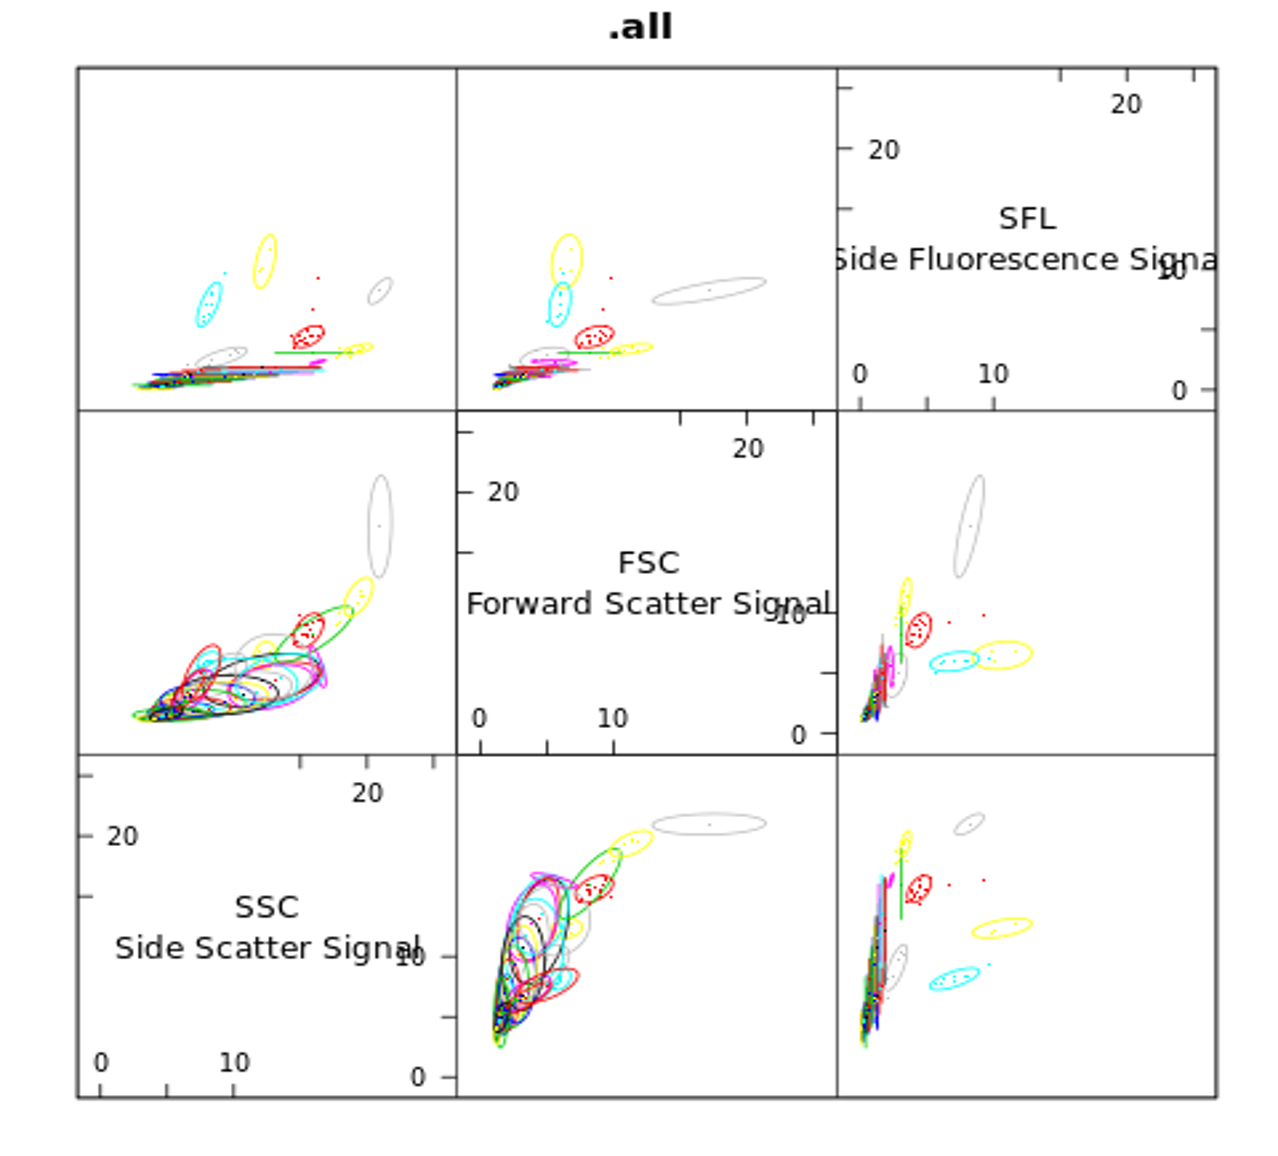
Meta-clustering of all populations from all samples to identify comparable clusters
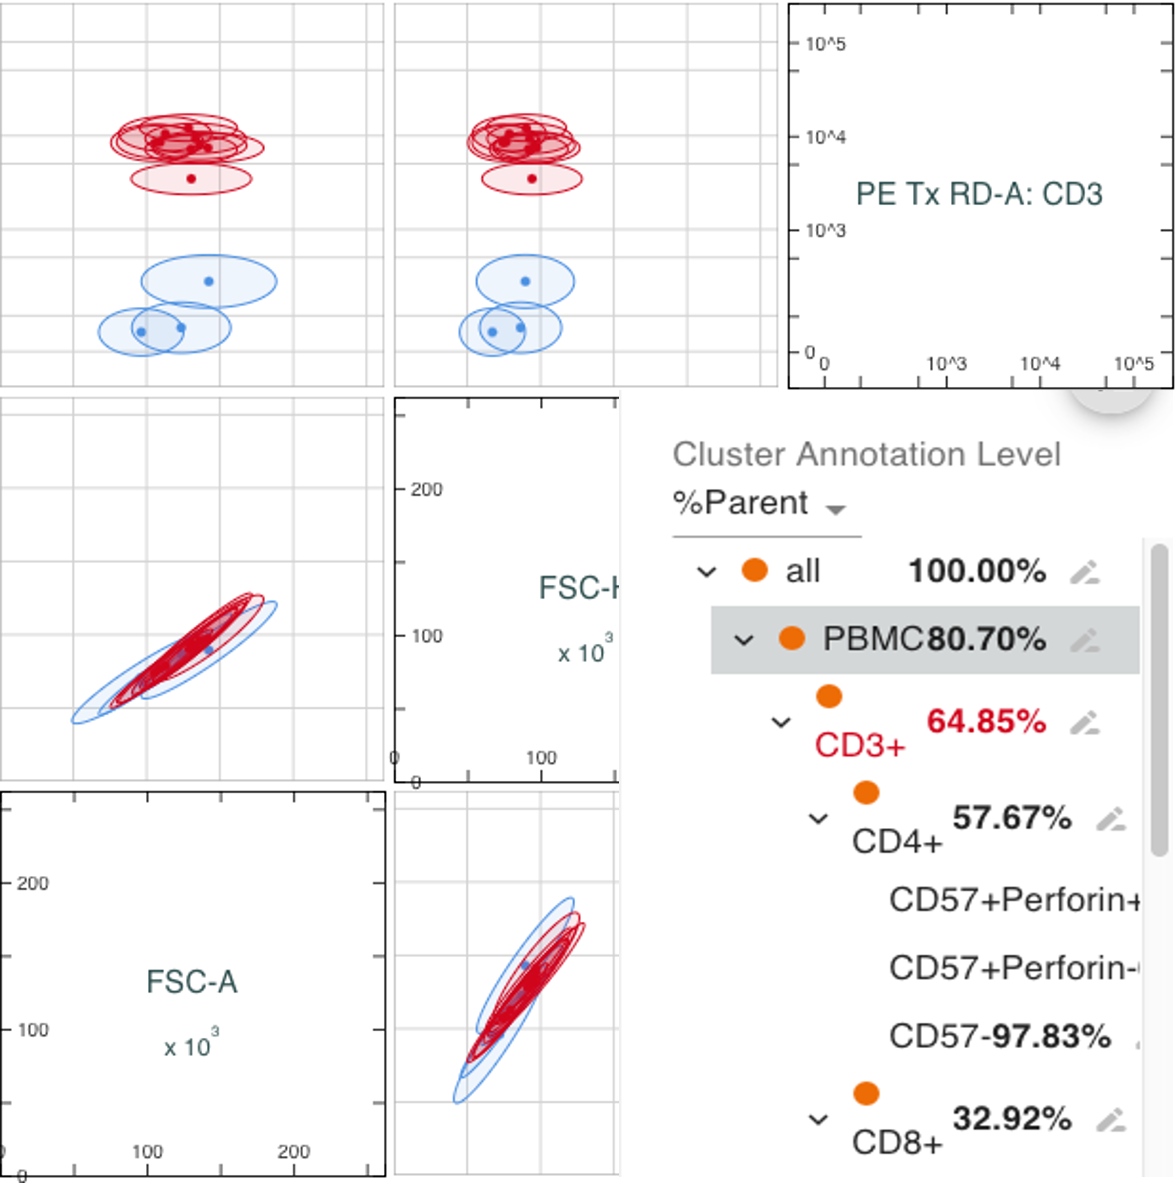
Annotation of relevant populations
Quantification of cell types by absolute and relative numbers and definition of reference values
Automated analysis of individual samples
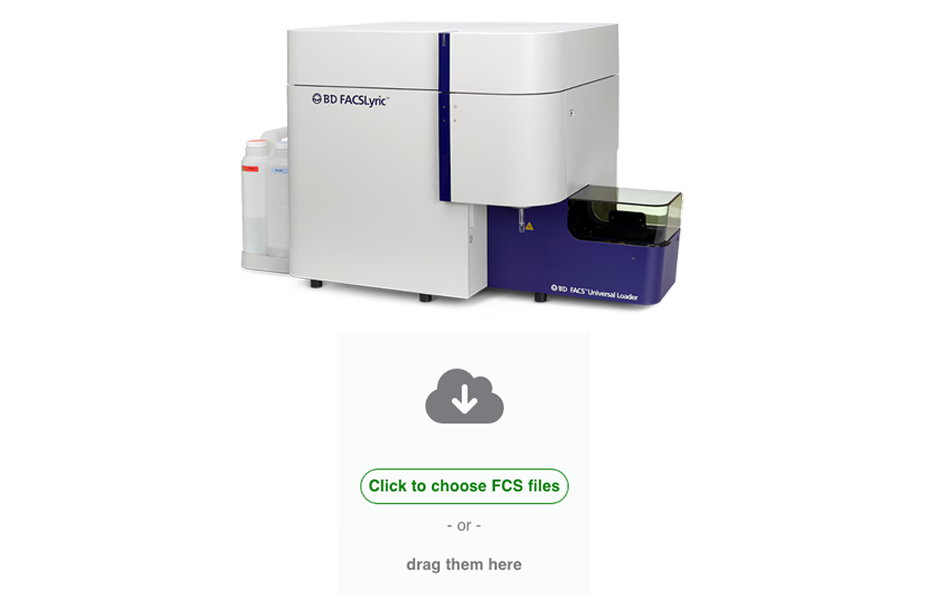
Staining, flow cytometry of an individual sample and data upload by client i.e. clinical laboratory
Automated multidimensional clusteringof cells with AI-tool immunoClust
Automated Meta-clusteringof all populations against reference model to identify annotated clusters
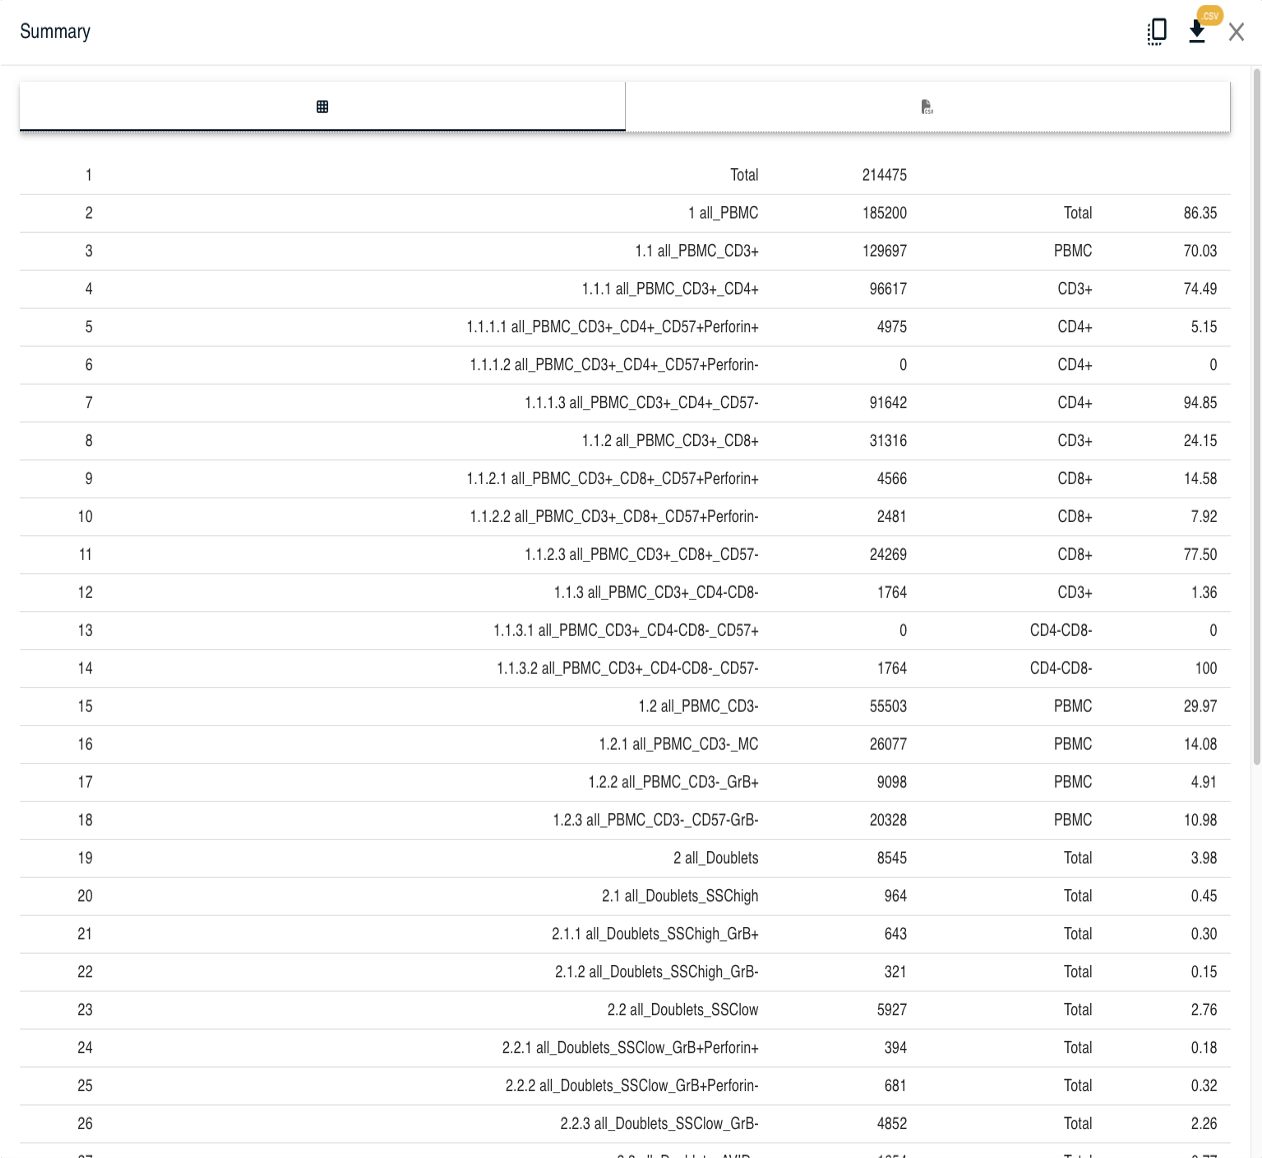
Automated quantificationof cell types by absolute and relative numbers and comparison to reference values
Laboratory
BioRetis
Initial Set up for a defined staining protocol
Staining and flow cytometry of blood cells from multiple samples of reference group (n=20 to 30)
Automated analysis of individual samples
Staining, flow cytometry of an individual sample and data upload by client i.e. clinical laboratory
Laboratory
Initial Set up for a defined staining protocol
AI-based automated multidimensional clustering of cells of each sample with immunoClust
Automated analysis of individual samples
Automated multidimensional clusteringof cells with AI-tool immunoClust
BioRetis
Initial Set up for a defined staining protocol
Meta-clustering of all populations from all samples to identify comparable clusters
Automated analysis of individual samples
Automated Meta-clustering of all populations against reference model to identify annotated clusters
BioRetis
Initial Set up for a defined staining protocol
Annotation of relevant populations
Automated analysis of individual samples
BioRetis
Initial Set up for a defined staining protocol
Quantification of cell types by absolute and relative numbers and definition of reference values
Automated analysis of individual samples
Automated quantification of cell types by absolute and relative numbers and comparison to reference values
BioRetis
Automated evaluation of cytometry data with iCAP
Advantages
- Developed especially for high-dimensional data sets (>10 markers / colors)
- Requires only an “FCS” file and is independent of the cytometer/manufacturer
- The calculation produces the same results when repeated for the same data set
- No user-dependent variation due to manual gating or sample-dependent non-specific shifts in marker intensities
- Automatic output of results showing quantitative deviations from reference values for cell count and variability of marker intensity in a population
- Automatic detection of new/unclear populations by setting specific threshold values
- Fully automated analysis of routine cytometry data from upload of „FCS“ files to output of results
- No staff time required for grouping data = more time for informed interpretation of results
- Extensive experience over several years through the evaluation of a cytometry-based cancer test
Prerequisite
- A defined staining protocol must be annotated and quantified once with a reference data set
What is currently immediately avaiable?
- Cloud computing solution for sequential calculation of complex flow cytometry data (single-cell clustering; population clustering)
- Focus on fluorescence flow cytometry
- Tools for dot plot output, population annotation, absolute and relative quantification of populations
- Integration into the laboratory infrastructure via API interfaces for data exchange possible
What still needs to be done?
- Obtaining individual requirements from the daily practice of a laboratory with FACS orders
- Setup for a defined staining
- User request for the output parameters
Competition
Competitors
- Are more focused on research (group comparisons, etc.)
- Do not offer complete automation and evaluation of individuell tests against a reference
- Are not well optimized for population comparisons between diffrent samples
- Software license instead of costs per sample
Our Solution Full automation of individual sample analysis instead of user guided comparisons
Summary
Our AI tool differs from all known developments in academic and industrial development in the following ways
Reliability and high specificity for diagnostic requirements for single sample measurements
Enormous safety advantage through automated, reproducible cell clustering and meta-clustering of populations against reference populations (manual evaluations can lead to user- or sample-dependent non-specific deviations of results due to user-dependent gating or fixed gating limits).
Tested in Cancer Screening Test with high specificity (≈80–85%) and high sensitivity (≈50–60%)
Reduction in staff time and costs, easier handling
No group comparisons as in research, but individual sample analysis compared to references for clinical use.
Significantly improved results in flow cytometry diagnostics
Proof of concept through cancer screening test in early marketing since 2017
Broad marketing in China from 2026
AI tool can be adapted quickly and easily for new applications (for other diagnoses and laboratory test applications)